
NFT Market Graph: Understanding the Digital Asset Boom and Bust
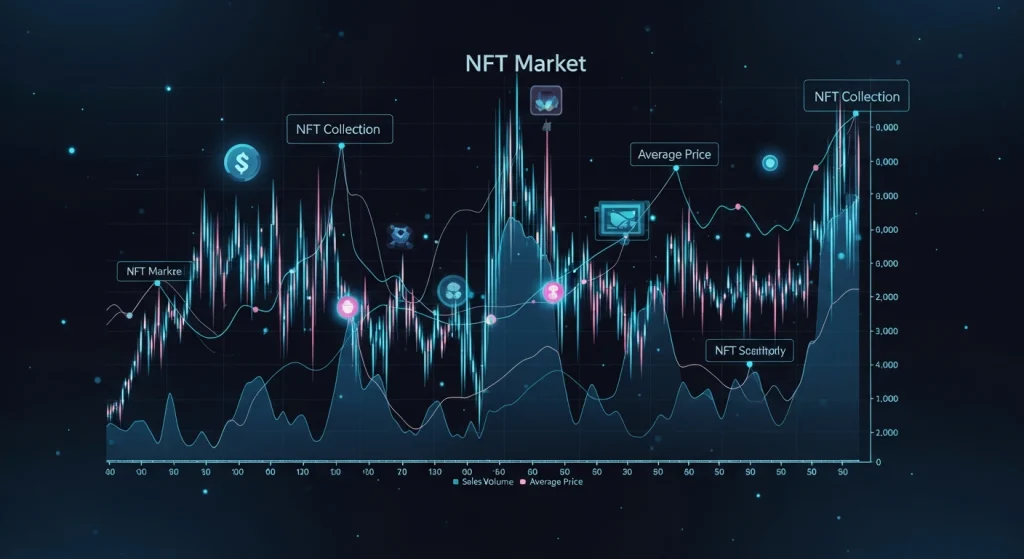
NFT markets have surged, corrected, and stabilized, driven by art, collectibles, and utility-based tokens. Market graphs reveal trading patterns, volatility, and floor price movements, guiding investors. Understanding trends, technical indicators, and real-world value is essential for long-term success.
The NFT market has experienced one of the most dramatic financial rollercoasters in recent history. From jaw-dropping million-dollar sales to devastating crashes, the non-fungible token space has captivated investors, artists, and skeptics alike. Understanding the market graphs and trends behind this digital phenomenon reveals crucial insights about speculative markets, digital ownership, and the future of blockchain technology.
NFT Market Foundations
NFTs (Non-Fungible Tokens) represent unique digital assets verified on a blockchain. They differ from cryptocurrencies in that each token is distinct and cannot be exchanged one-to-one. Understanding the fundamentals of NFTs—including ownership, token standards, and marketplaces—provides a basis for analyzing market trends. NFTs span art, gaming, music, and collectibles, each with its own trading dynamics. Market graphs track sales volume, transaction counts, and collection floor prices, revealing investor interest and liquidity. Foundational knowledge helps users interpret market data accurately, distinguish between speculative hype and sustainable growth, and identify trends for smart investment strategies.
The Meteoric Rise: 2020-2021 NFT Market Explosion
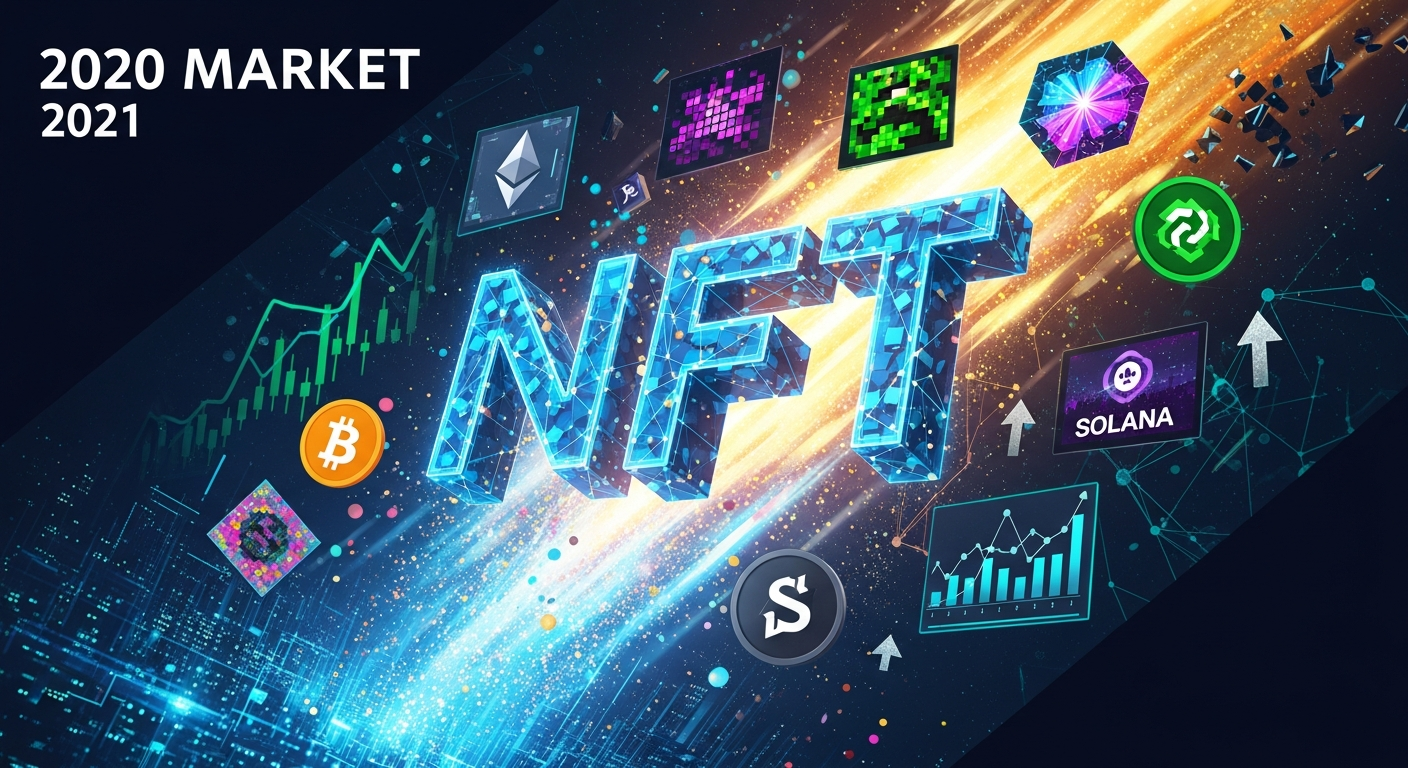
The NFT market graph tells a story of unprecedented growth that began in earnest during 2020. What started as a niche corner of the cryptocurrency world transformed into a multi-billion dollar market seemingly overnight.
Early Market Indicators
The foundation for the NFT boom was laid years before mainstream adoption. Crypto Kitties, launched in 2017, demonstrated the potential for digital collectibles on the blockchain. However, it wasn’t until 2020 that market graphs began showing consistent upward momentum.
Several factors contributed to this initial growth phase:
Digital Art Revolution
Artists discovered new monetization opportunities through tokenizing their work. Platforms like Super Rare and Foundation provided venues for creators to sell unique digital pieces.
Celebrity Endorsements High-profile figures began purchasing and promoting NFTs, creating mainstream awareness and driving demand.
Pandemic-Driven Digital Adoption: With more people spending time online, digital assets gained increased acceptance and appeal.
The Peak: Early 2021 Market Surge
The NFT market graph reached its most dramatic peak in the first quarter of 2021. Trading volumes exploded from millions to billions of dollars within months. This surge was characterized by several landmark events that captured global attention.
The sale of Beeple’s “Everydays: The First 5000 Days” for $69.3 million at Christie’s auction house marked a watershed moment. This single transaction legitimized NFTs in traditional art circles and sent shockwaves through financial markets.
OpenSea, the largest NFT marketplace, saw trading volumes increase exponentially during this period. Monthly trading volumes that had previously measured in the tens of millions suddenly reached billions.
Market Dynamics and Trading Patterns
Understanding NFT market graphs requires examining the unique characteristics that differentiate this asset class from traditional investments.
Volatility and Speculation
NFT markets exhibit extreme volatility patterns that make traditional market analysis challenging. Unlike stocks or bonds, NFTs lack standardized valuation methods, leading to price discovery through pure market sentiment.
The speculative nature of NFT trading created bubble-like conditions. Many investors entered the market without understanding the underlying technology or long-term value propositions. This speculative fever contributed to unsustainable price increases across numerous NFT collections.
Collection-Based Trading
NFT market graphs reveal trading patterns organized around specific collections rather than individual assets. Projects like CryptoPunks, Bored Ape Yacht Club, and Art Blocks generated their own micro-economies within the broader NFT ecosystem.
These collections often experienced coordinated price movements, with floor prices (the lowest-priced items in a collection) serving as key indicators of overall collection health. Market graphs tracking floor prices became essential tools for NFT traders and investors.
The Great NFT Market Correction
The euphoria surrounding NFTs couldn’t last forever. Market graphs from mid-2021 onwards reveal a sobering correction that brought prices back to earth and forced a reassessment of the entire ecosystem.
Causes of the Decline
Multiple factors contributed to the NFT market’s downturn:
Market Saturation: The success of early NFT projects led to an explosion of new collections, diluting demand across an increasingly crowded marketplace.
Regulatory Uncertainty: Government agencies began scrutinizing NFTs, raising questions about their legal status and potential regulations.
Environmental Concerns: Criticism of blockchain technology’s energy consumption, particularly on Ethereum, created negative sentiment around NFT trading.
Economic Headwinds: Broader economic concerns, including inflation and recession fears, led investors to reduce exposure to speculative assets.
Impact on Different Market Segments
The correction affected various segments of the NFT market differently. Blue-chip collections like CryptoPunks maintained relatively stronger positions, while newer projects saw more dramatic declines.
Art-focused NFTs experienced significant value drops, with many pieces selling for fractions of their peak prices. Gaming and utility-focused NFTs showed more resilience, suggesting that practical applications might provide more sustainable value propositions.
Current Market Analysis and Trends
Recent NFT market graphs paint a picture of stabilization at significantly lower levels than peak periods. This normalization phase offers valuable insights into the market’s true underlying demand.
Volume and Value Metrics
Trading volumes have stabilized at levels well below peak activity but remain substantially higher than pre-boom periods. This suggests that while speculative excess has been eliminated, genuine interest in NFTs persists.
The average sale price of NFTs has also normalized, with most transactions occurring at much lower price points than during the height of the boom. This price correction has made NFTs more accessible to a broader range of participants.
Emerging Use Cases
Market graphs now reflect increased activity in practical NFT applications beyond speculative trading. Gaming NFTs, membership tokens, and utility-focused projects are showing more consistent trading patterns.
The integration of NFTs into established gaming platforms and social media networks suggests that utility-driven demand may provide more sustainable market foundations than purely speculative trading.
Technical Analysis of NFT Market Graphs
Reading NFT market graphs requires understanding unique metrics and indicators specific to this asset class.
Key Metrics to Track
Floor Price Movements: The lowest-priced items in popular collections serve as bellwethers for overall market sentiment.
Trading Volume: Daily and weekly trading volumes indicate market activity levels and liquidity.
Unique Buyers and Sellers: The number of distinct wallet addresses participating in trading reveals market participation breadth.
Market Capitalization: Total value of all NFTs provides a macro view of market size and trends.
Chart Patterns and Indicators
Traditional technical analysis tools have limited applicability to NFT markets due to their unique characteristics. However, some patterns have emerged:
Support and resistance levels often form around psychologically significant price points or historical transaction clusters. Volume spikes frequently coincide with major announcements or celebrity endorsements.
Moving averages can help identify trending directions, though the high volatility of NFT markets makes these indicators less reliable than in traditional asset classes.
Future Outlook and Market Predictions
The NFT market graph’s future trajectory remains uncertain, with several competing forces likely to influence its direction.
Positive Factors
Technology Improvements: Layer 2 solutions and more energy-efficient blockchains are addressing scalability and environmental concerns.
Institutional Adoption: Major corporations are exploring NFT applications for brand engagement and customer loyalty programs.
Regulatory Clarity: Clear regulatory frameworks could provide the certainty needed for broader institutional participation.
Potential Challenges
Market Maturation: As the market matures, explosive growth periods may become less frequent.
Competition: Alternative digital ownership models may emerge to challenge NFTs’ market position.
Economic Conditions: Broader economic downturns could continue to impact speculative asset classes like NFTs.
What NFT Market Graphs Teach Us About Digital Assets
The NFT market’s journey from obscurity to mainstream attention and back toward normalization offers valuable lessons for understanding digital asset markets.
The extreme volatility demonstrated in NFT market graphs highlights the challenges of valuing unique digital assets. Unlike fungible cryptocurrencies, each NFT’s value depends on subjective factors like artistic merit, rarity, and cultural significance.
The role of community and social proof in driving NFT values cannot be understated. Market graphs often show price movements that correlate more closely with social media buzz and influencer activity than traditional financial metrics.
The NFT market’s evolution suggests that sustainable growth in digital asset markets requires genuine utility beyond speculative trading. Projects that provide real value to users show more resilient price action in market graphs.
Understanding how to read and interpret NFT market graphs has become an essential skill for anyone interested in digital assets. These graphs tell the story of a revolutionary technology finding its place in the global financial ecosystem, complete with the growing pains and corrections that accompany any major innovation.
The future of NFTs will likely be determined by their ability to provide genuine value beyond speculative trading. Market graphs will continue to reflect this evolution, serving as a real-time indicator of the technology’s progress toward mainstream adoption and practical utility.
NFT Market Regulations and Legal Landscape
Governments are increasingly scrutinizing NFTs regarding taxation, securities law, and intellectual property. Regulatory clarity affects investor confidence and long-term market stability. Market graphs often react to news about legal frameworks, compliance requirements, and global blockchain policies. Staying informed about regulations helps participants mitigate legal risks and anticipate shifts in market dynamics.
Conclusion
NFT markets have experienced unprecedented highs and rapid corrections, reflecting both speculative fervor and emerging utility. Market graphs provide insights into trading behavior, floor prices, and collection health. Long-term success in NFTs requires understanding underlying value, tracking technical indicators, and identifying utility-driven projects. As adoption matures, sustainable growth and practical applications will determine the future of this digital asset class.
FAQs – NFT Market
1. What is an NFT?
NFT (Non-Fungible Token) is a unique digital asset stored on a blockchain. Unlike cryptocurrencies, each NFT is distinct and cannot be exchanged one-to-one. NFTs represent art, collectibles, gaming items, music, and other digital ownership rights.
2. How does the NFT market work?
The NFT market operates on blockchain-based platforms where creators mint, sell, and trade tokens. Buyers purchase NFTs using cryptocurrencies, while market graphs track trading volume, floor prices, and unique participants to reflect demand and liquidity.
3. What are blue-chip NFT collections?
Blue-chip collections are well-established NFTs with high credibility, strong communities, and proven market value. Examples include CryptoPunks, Bored Ape Yacht Club, and Art Blocks. They often show more stable price trends during market volatility.
4. Why did NFTs surge in popularity in 2020-2021?
NFTs gained mainstream attention due to digital art adoption, celebrity endorsements, pandemic-driven online engagement, and platforms like OpenSea and SuperRare. Record-breaking sales, social media hype, and accessibility attracted both collectors and investors.
5. How do NFT market graphs track trends?
NFT market graphs analyze metrics such as floor prices, trading volume, unique buyers and sellers, and market capitalization. Patterns in graphs reveal price trends, collection health, and investor sentiment over time.
6. Why are NFT prices so volatile?
NFT prices fluctuate due to speculative demand, limited supply, community trends, influencer endorsements, and social media buzz. Lack of standardized valuation methods and subjective factors like rarity and cultural relevance amplify volatility.
7. What caused the NFT market correction?
The correction was driven by market saturation, regulatory uncertainty, broader economic concerns, and criticism of blockchain energy consumption. Many speculative projects experienced steep price declines, while blue-chip NFTs remained relatively stable.
8. How can utility-focused NFTs provide sustainable value?
NFTs offering real-world or digital utility—like gaming tokens, membership access, or social perks—maintain consistent demand. Utility-driven NFTs create measurable value for holders, fostering long-term adoption and more stable price trends.
9. What metrics are essential for analyzing NFT graphs?
Key metrics include floor price movements, trading volume, unique buyers and sellers, market capitalization, and social engagement. These indicators help assess market sentiment, liquidity, and the potential for growth or decline.
10. How do celebrity endorsements impact NFT prices?
Celebrity promotion increases visibility, credibility, and demand for NFTs. High-profile endorsements can trigger short-term price spikes, elevate social media buzz, and influence overall collection trends.
11. Can online-only investors benefit from NFTs?
Yes. Even without a physical presence, investors can participate via NFT marketplaces, monitor market graphs, analyze trends, and engage in utility-driven projects for long-term growth and potential profits.
12. What are the future trends in NFT markets?
Future trends include growth in gaming NFTs, social media integration, utility-driven tokens, institutional adoption, Layer 2 blockchain solutions, and clearer regulations. Sustainable growth is expected to focus on real value rather than speculation.